Reporting: ability to see % and value in Bar chart: above each column
Gathering Feedback
Reporting:
need ability to see % and value in Bar chart: above each column.
To see right now (currently i see only value and only when i touch column by mouse)
Need like as:
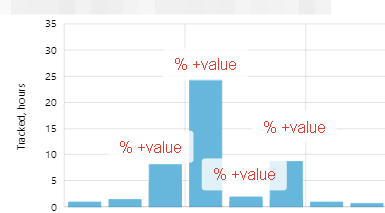
-

Hi Vladimir
thank you for raising this!
To make sure I understand your request correctly, you are expecting to see the % of the total, correct? Or per user?
Kind Regards,
Andrea
Product Owner - www.7pace.com
Please sign in to leave a comment.
Comments
1 comment