
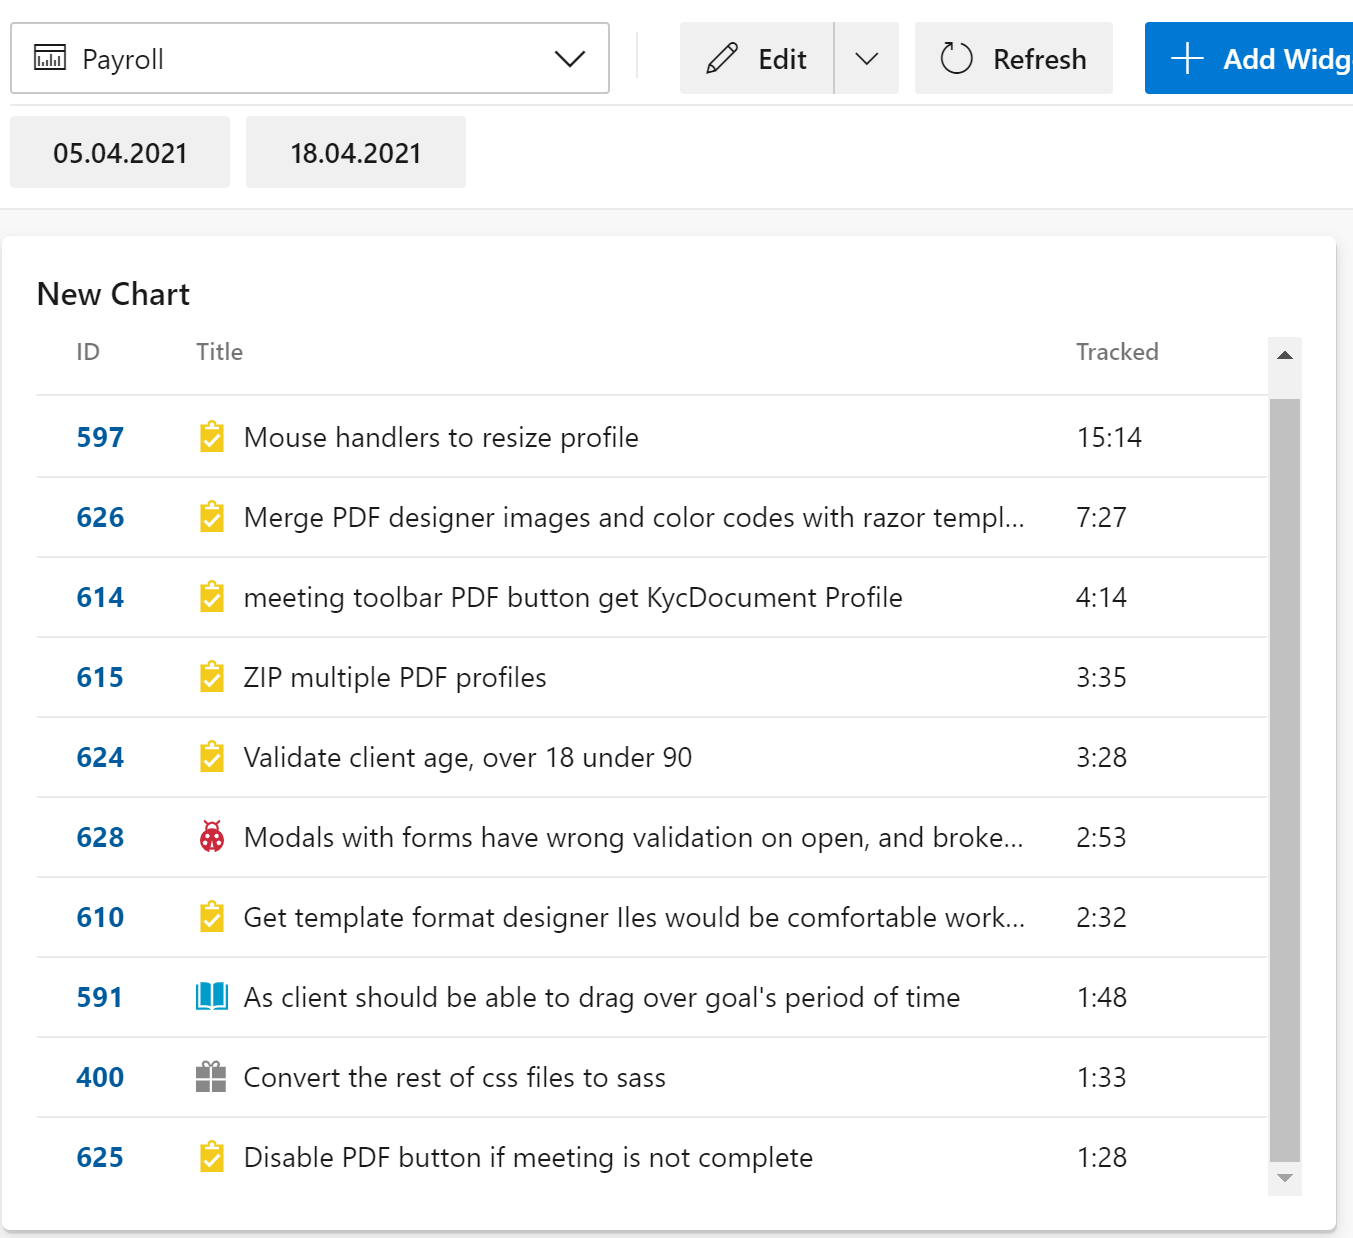
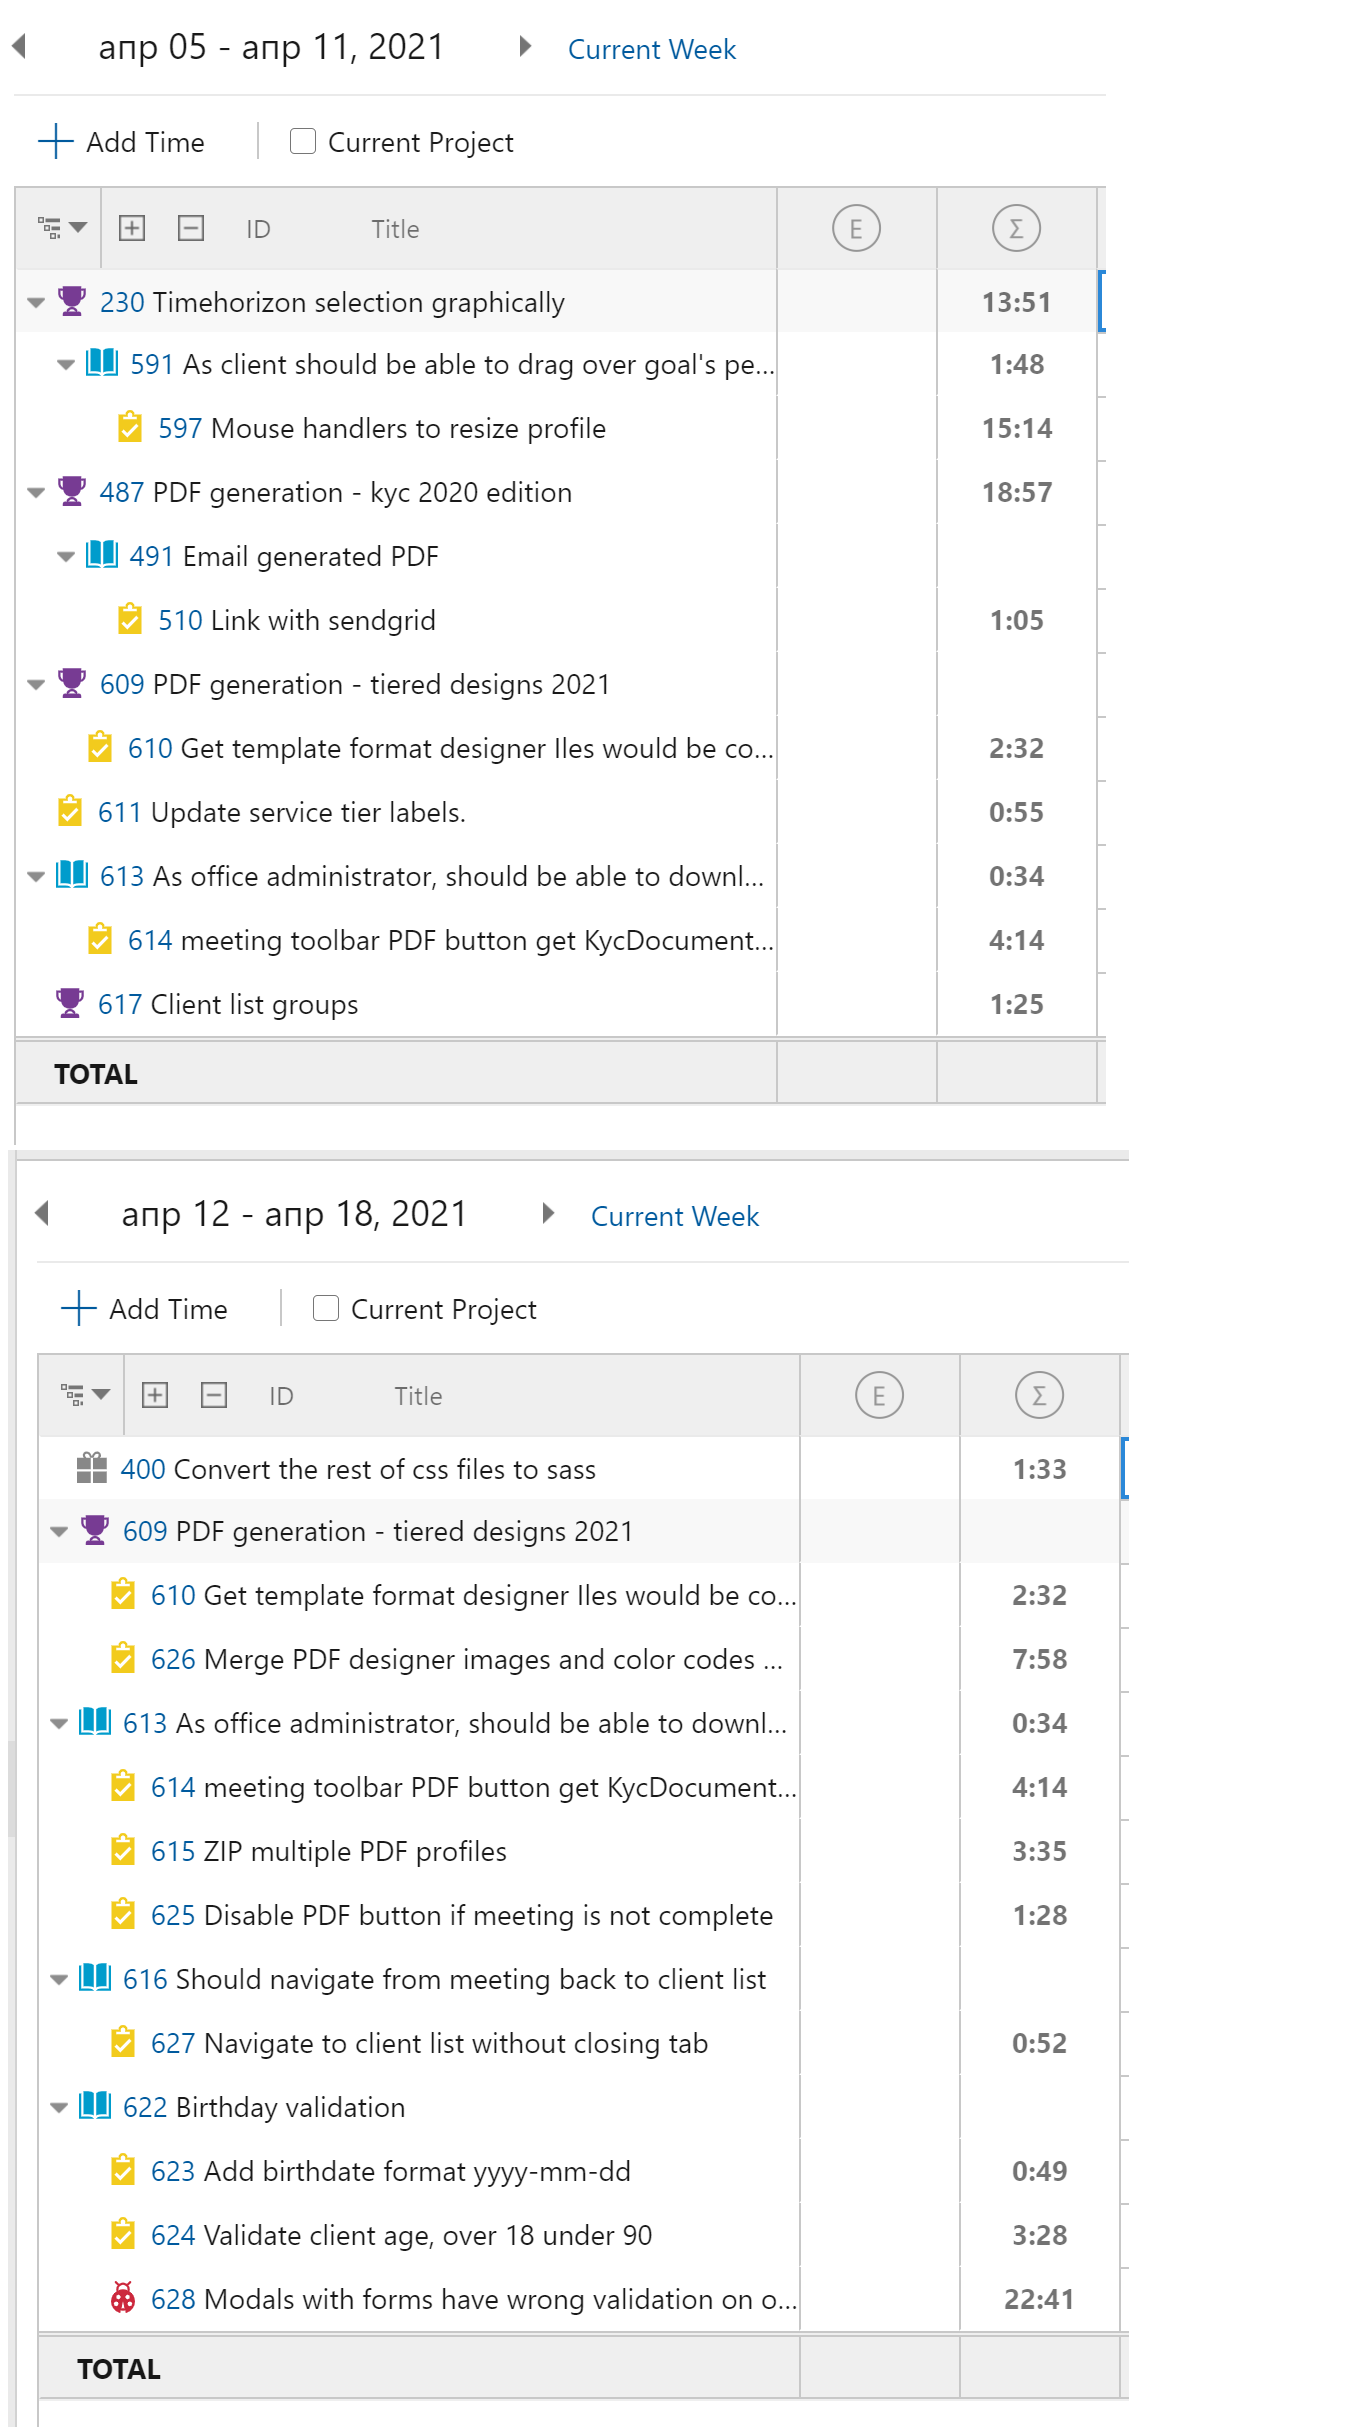
When I use Reporting to get all hours and work items worked on for a time period, it is missing items that do show up in Timesheet. This does not happen for all time periods, and I cannot find the pattern on why sometimes report does not wok. In this example report is missing many items: 510, 611, 617, 613, 617, 613, 627, 623.
Thanks for suggestions.
-
Thanks for reply!
Exported definition:
{"type":"FlatTable","id":"","query":"$filter=TrackedItself gt 0&$orderby=TrackedItself desc&$top=10","odataVersion":"v3.0","endpoint":"workItems","title":"New Chart","subTitle":null,"w":4,"h":3,"columns":[{"field":"System_Id","title":"ID","formatter":"WorkItemId","width":60},{"field":["System_Title","System_WorkItemType","System_TeamProject"],"title":"Title","formatter":"WorkItemIndicator","width":-100},{"field":"TrackedItself","title":"Tracked","width":100,"formatter":"TimeLength"}],"autoSubtitle":false,"timeframeFilter":null,"y":0,"x":0}
-

Hello Alexander,
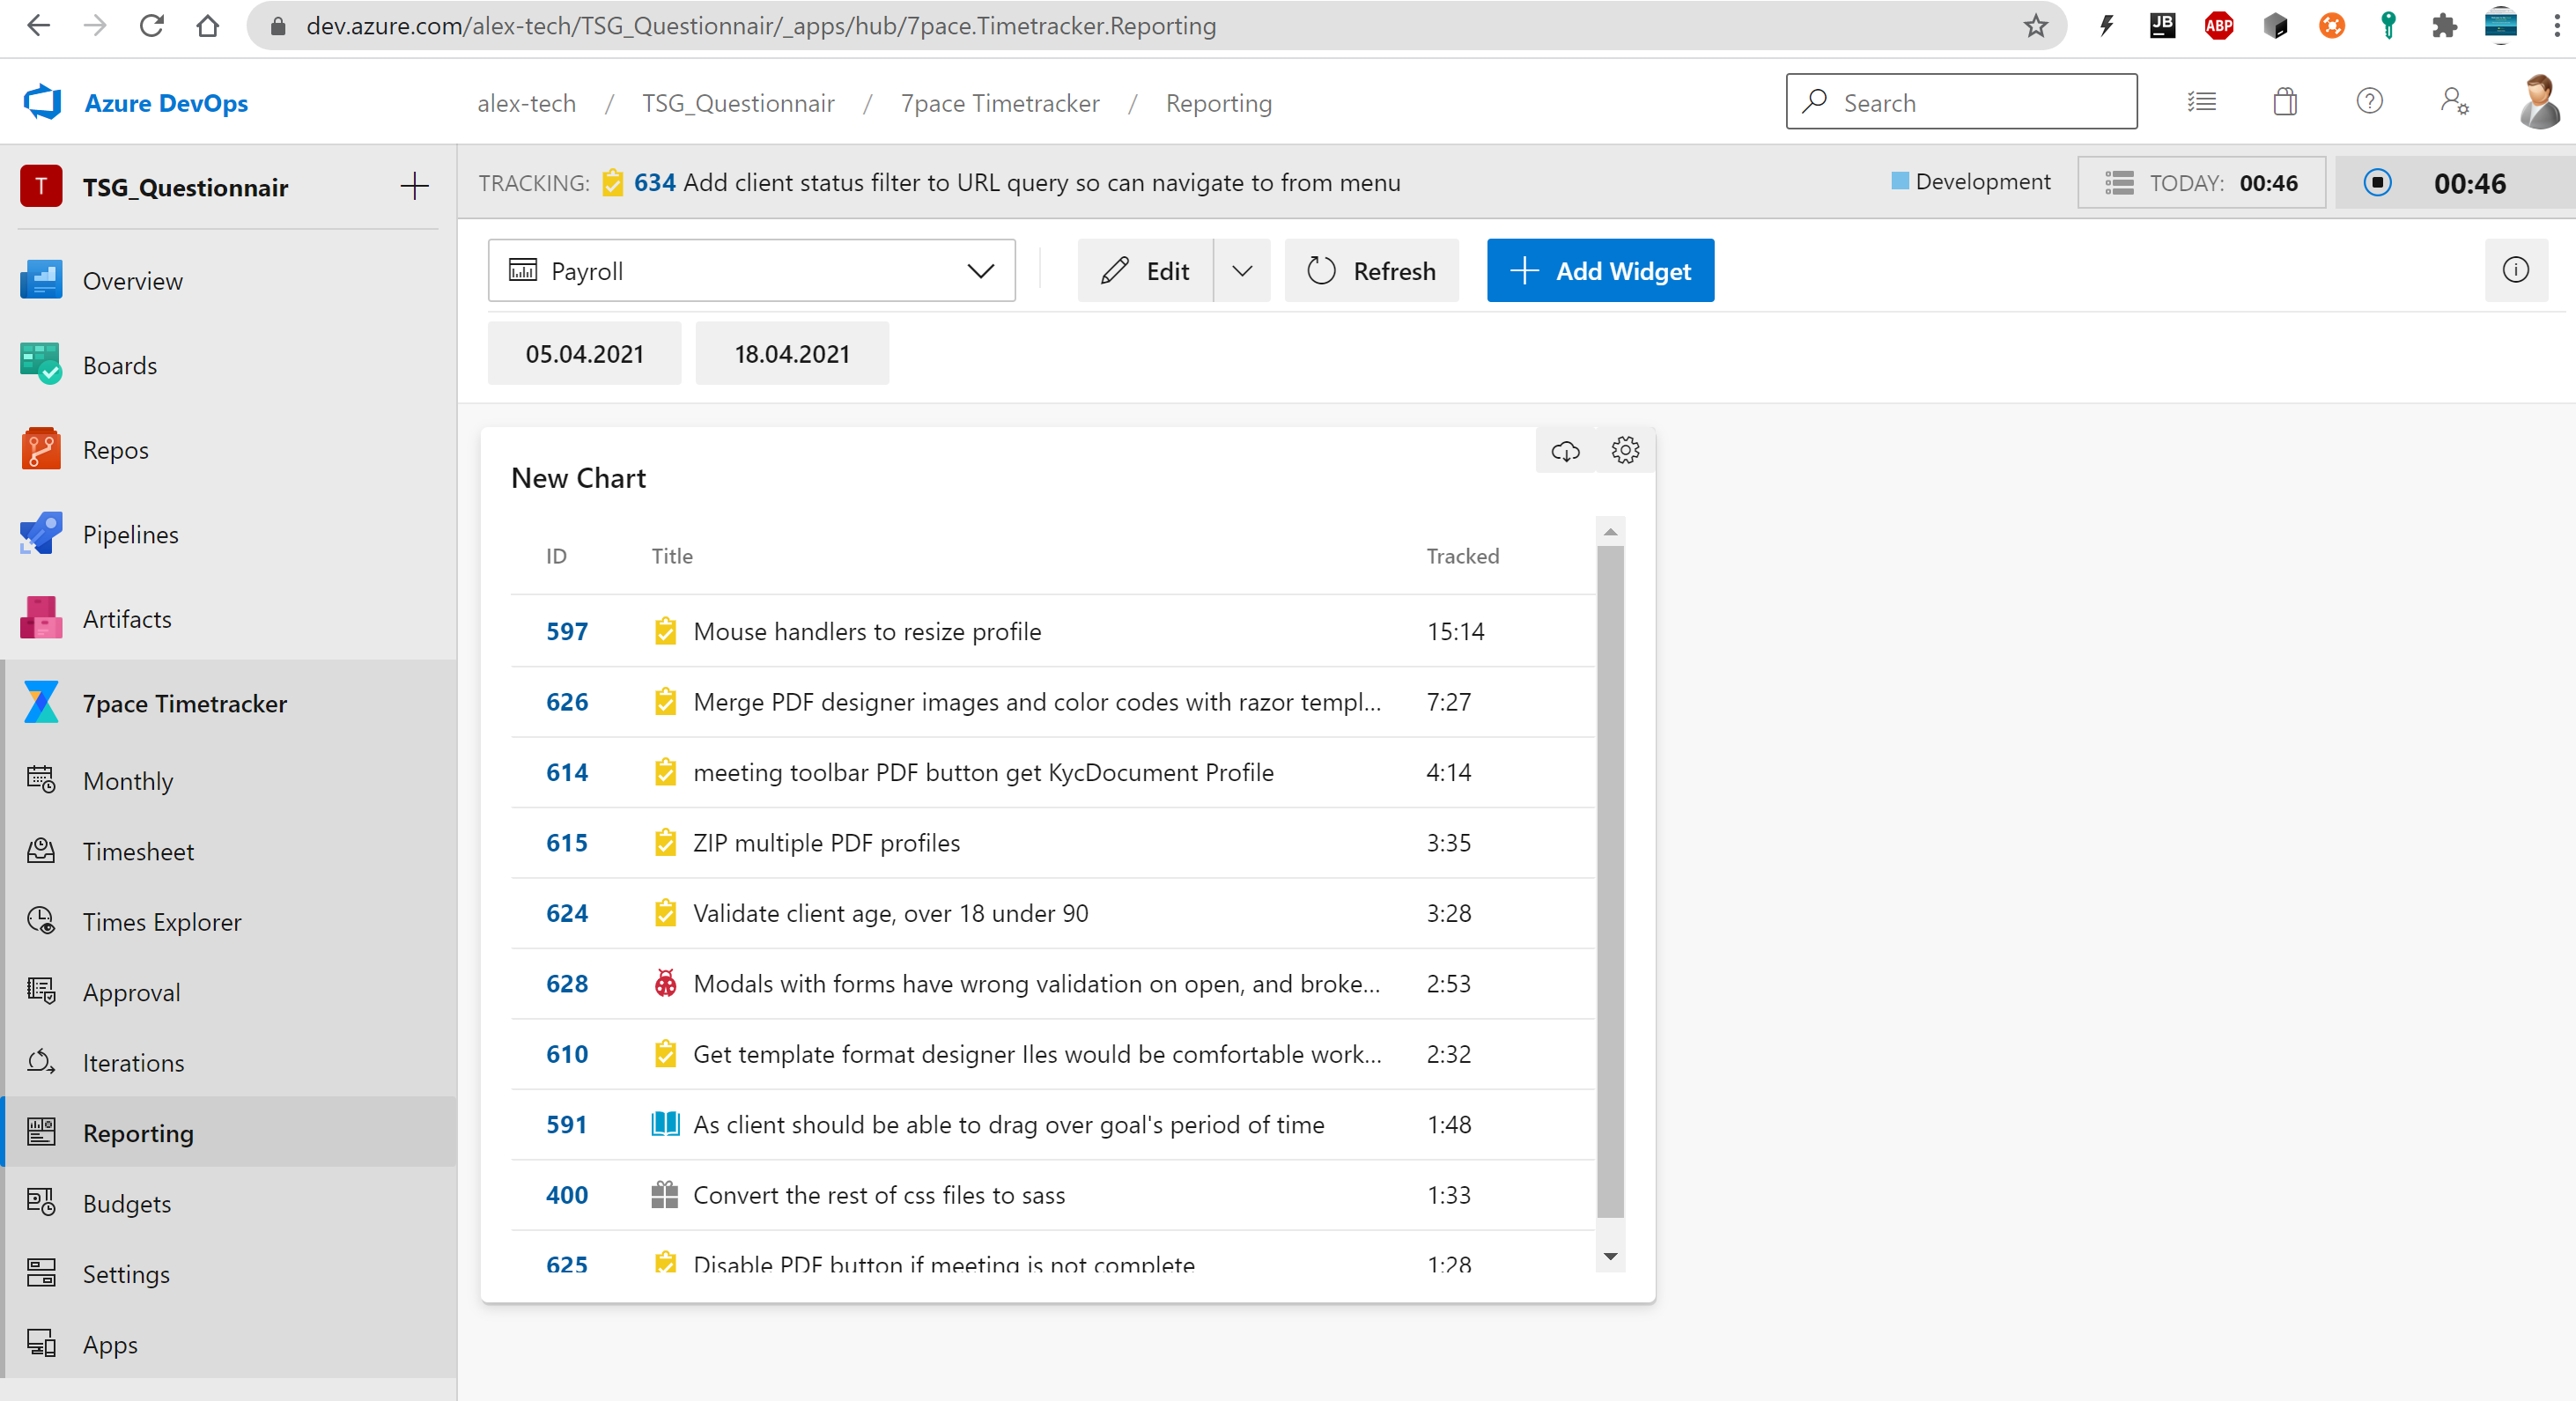
Thank you. Are you using any filters on the Reporting Dashboard? The widget works fine on our end, and I can see on your Timesheet page screenshot that the Current Project filter is not enabled, so all items are shown. If you are using a Project filter on the Reporting Dashboard, this could be why you are seeing only a part of the work items.
Please let me know.
Best regards,
Vanja -
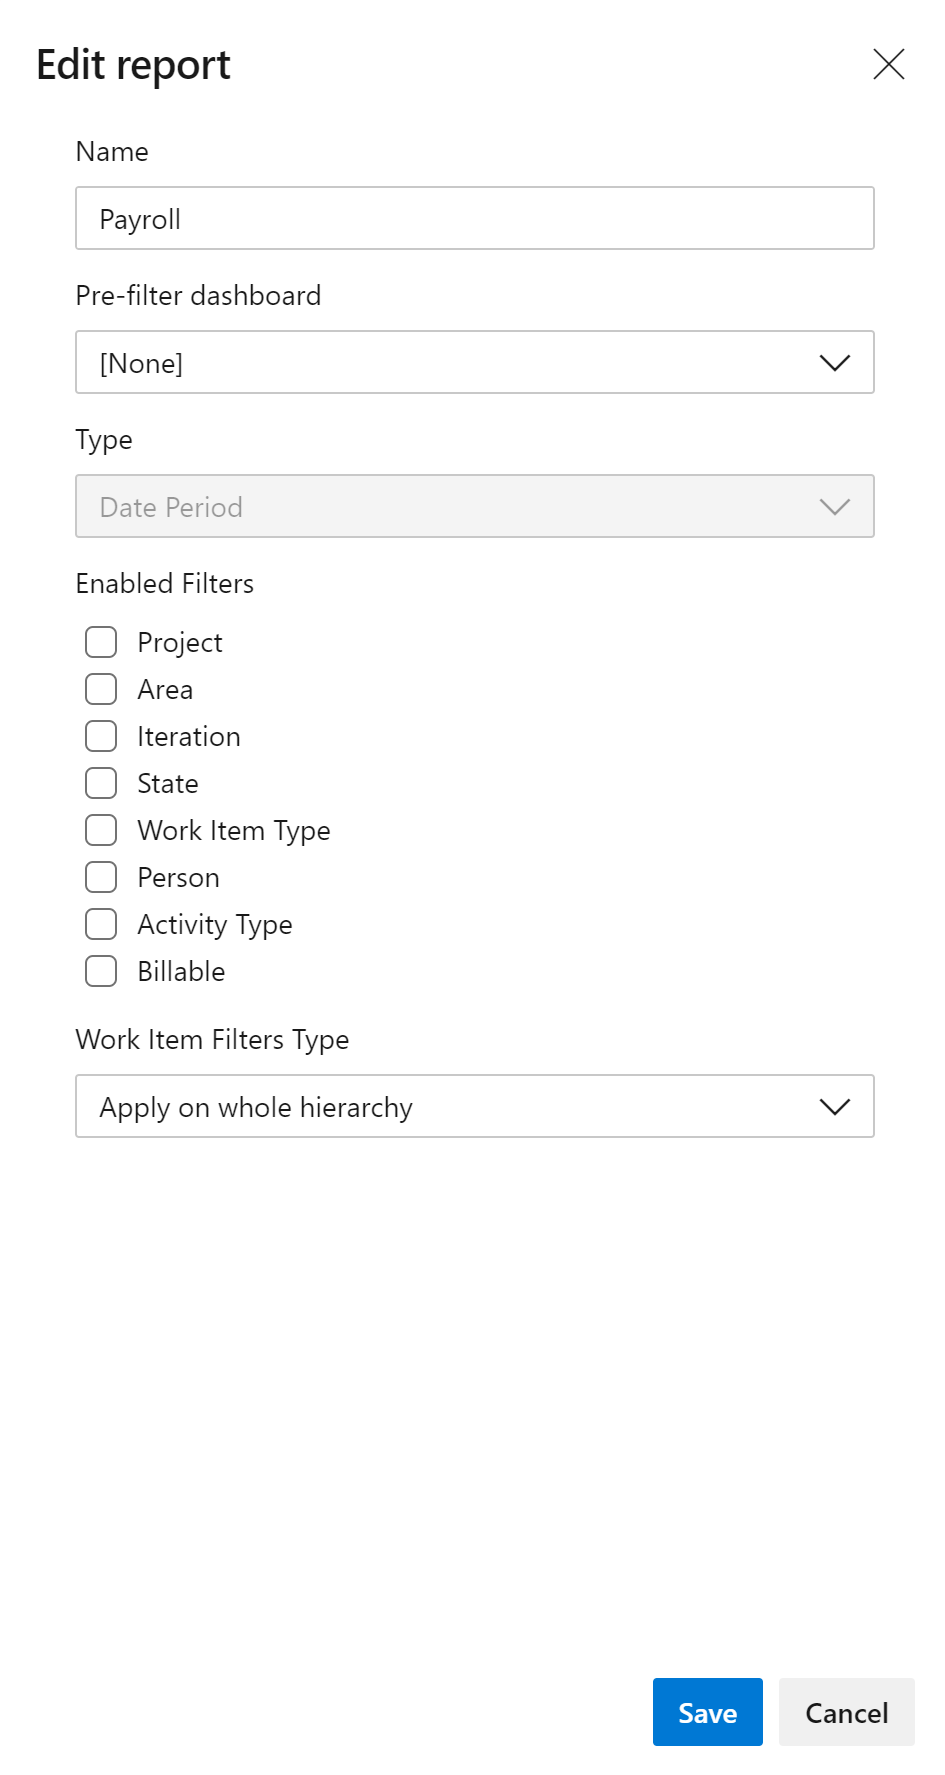
There are no filters or pre-filters, just a default widget with time range.
It feels like somekind of "intermitent" issue, as all of items since 19th April to today are displayed correctly. Another time items were missing I think was back in February. Anything else I can do to help find the problem?
-
Hello Alexander,
Please try the following definition:
{"type":"FlatTable","id":"","query":"$filter=TrackedItself gt 0&$orderby=TrackedItself","odataVersion":"v3.0","endpoint":"workItems","title":"New Chart","subTitle":null,"w":4,"h":3,"columns":[{"field":"System_Id","title":"ID","formatter":"WorkItemId","width":60},{"field":["System_Title","System_WorkItemType","System_TeamProject"],"title":"Title","formatter":"WorkItemIndicator","width":-100},{"field":"TrackedItself","title":"Tracked","width":100,"formatter":"TimeLength"}],"autoSubtitle":false,"timeframeFilter":null,"y":53,"x":0}
Best regards,
Vanja
Please sign in to leave a comment.
Comments
8 comments